Hi folks, today I’m here to share a sample frontend and backend application running on Kubernetes via Minikube.
I found myself trying to solve this and found this great tutorial about it. In my case, was necessary to adapt some portions of it to use minikube and run it locally.
You can check also the source tutorial here
Step 0 - Set up your tools
Virtualbox (for virtualization):
brew cask install virtualbox
HyperKit:
brew install hyperkit
Docker:
brew cask install docker
Kubernetes CLI & kubectl:
brew install kubernetes-cli
Minikube => Local Kubernetes:
brew cask install minikube
Helm => Chart management (optional):
brew install kubernetes-helm
Step 2. Set up Kubernetes cluster and CLI
Starting a Minikube cluster. Here are some useful commands to start the Minikube cluster.
$ minikube start --vm-driver hyperkit --cpus 8 --memory 4048 --disk-size 10g && minikube addons enable ingress
$ kubectl config current-context minikube
$ minikube status
$ minikube stop
$ minikube logs
$ minikube stop && minikube delete
$ docker rm -f $(docker ps -aq)
$ minikube start --vm-driver=hyperkit
And here is the sample result for:
$ minikube start --vm-driver hyperkit --cpus 8 --memory 4048 --disk-size 10g && minikube addons enable ingress
😄  minikube v1.14.1 on Darwin 10.15.7
✨  Using the hyperkit driver based on existing profile
💿  Downloading VM boot image ...
    > minikube-v1.14.0.iso.sha256: 65 B / 65 B [-------------] 100.00% ? p/s 0s
    > minikube-v1.14.0.iso: 178.27 MiB / 178.27 MiB [] 100.00% 5.57 MiB p/s 33s
👍  Starting control plane node minikube in cluster minikube
🔄  Restarting existing hyperkit VM for "minikube" ...
🐳  Preparing Kubernetes v1.19.2 on Docker 19.03.12 ...
You can also use this:
$ minikube addons enable ingress
$ minikube addons enable storage-provisioner
$ minikube addons enable default-storageclass
$ minikube ip
Minikube comes with several addons such as Kubernetes Dashboard, Kubernetes DNS, etc. We can list the available addons via
$ minikube addons list
- addon-manager: enabled
- dashboard: enabled
- default-storageclass: enabled
- kube-dns: enabled
- heapster: enabled
- ingress: disabled
- registry-creds: disabled
We can also enable/disable some addons via:
$ minikube addons disable dashboard
$ minikube addons enable heapster
To open the corresponding web interface to a specific addon, e.g., heapster, we can issue the following command.
$ minikube addons open heapster
This will open a browser showing the web interface of heapster.
Run $ kubectl cluster-info and you should see something like:
kubernetes master is running at https://192.168.64.2:8443
kubernetes-dashboard is running at https://192.168.64.2:8443/api/v1/proxy/namespaces/kube-system/services/kubernetes-dashboard
You can use kubectl as a proxy to authenticate to your API server:
$ kubectl proxy
Starting to serve on 127.0.0.1:8001
Point the browser to http://127.0.0.1:8001/ and you will see a list of the supported Kubernetes APIs.
To select the minikube local cluster for kubectl - useful if you are using multiple clusters - then run kubectl config use-context minikube:
$ kubectl describe service kubernetes
Name:              kubernetes
Namespace:         default
Labels:            component=apiserver
                   provider=kubernetes
Annotations:       <none>
Selector:          <none>
Type:              ClusterIP
IP:                10.96.0.1
Port:              https  443/TCP
TargetPort:        8443/TCP
Endpoints:         192.168.64.3:8443
Session Affinity:  None
Events:            <none>
Here are also some useful commands:
$ kubectl cluster-info
$ kubectl get pods --all-namespaces
$ kubectl get nodes
$ minikube dashboard
$ minikube addons list
$ kubectl config current-context minikube
Check all that is currently running:
$ kubectl -n kube-system get pod
Deploying the Dashboard UI:
$ minikube dashboard
You will see something like this:
🔌  Enabling dashboard ...
🤔  Verifying dashboard health ...
🚀  Launching proxy ...
🤔  Verifying proxy health ...
🎉  Opening http://127.0.0.1:57817/api/v1/namespaces/kubernetes-dashboard/services/http:kubernetes-dashboard:/proxy/ in your default browser...
Getting just the dashboard URL: If you don’t want to open a web browser, the dashboard command can also simply emit a URL:
$ minikube dashboard --url
🤔  Verifying dashboard health ...
🚀  Launching proxy ...
🤔  Verifying proxy health ...
http://127.0.0.1:52804/api/v1/namespaces/kubernetes-dashboard/services/http:kubernetes-dashboard:/proxy/
The Dashboard UI is not deployed by default. To deploy it, run the following command:
kubectl apply -f https://raw.githubusercontent.com/kubernetes/dashboard/v2.0.0/aio/deploy/recommended.yaml
docker pull vmoll/kubernetes-demo-frontend:v1

docker pull vmoll/kubernetes-demo-backend:v1
Command line proxy: You can access Dashboard using the kubectl command-line tool by running the following command:
$ kubectl proxy
Kubectl will make Dashboard available at http://localhost:8001/api/v1/namespaces/kubernetes-dashboard/services/https:kubernetes-dashboard:/proxy/.
Deploy items on Kubernetes:
$ kubectl apply -f file
$ kubectl get pods
Get the URL from the service:
$ minikube service name-service --url
$ minikube service to-do-app-frontend --url
$ minikube service to-do-app-backend --url
Port forwarding:
Pods are allocated a private IP address by default and cannot be reached outside of the cluster. You can use the kubectl port-forward command to map a local port to a port inside the pod like this:
$ kubectl port-forward to-do-app-backend-69b45499fb-7fh87 8080:8080
$ kubectl port-forward to-do-app-frontend-69b45499fb-7fh87 80:80
Logs from Pods:
You can also stream the Pod logs by typing the following command:
$ kubectl logs -f to-do-app-backend-69b45499fb-7fh87
$ kubectl logs -f to-do-app-frontend-69b45499fb-7fh87
Step 3. Database configuration setup
$ kubectl apply -f backend-deployment.yaml
service/to-do-app-backend created
deployment.apps/to-do-app-backend created
$ kubectl apply -f mysql-configmap.yaml
configmap/db-conf created
$ kubectl apply -f db-root-credentials-secret.yaml
secret/db-root-credentials created
$ kubectl apply -f db-credentials-secret.yaml
secret/db-credentials created
$ kubectl get pods
NAME                                 READY   STATUS              RESTARTS   AGE
to-do-app-backend-645c66fbd4-jq26m   0/1     ContainerCreating   0          29s
Step 4. Configure PVC, service, and deployment for database
$ kubectl apply -f mysql-deployment.yaml
service/mysql created
persistentvolumeclaim/mysql-pv-claim created
deployment.apps/mysql created
$ kubectl get deployments
NAME                READY   UP-TO-DATE   AVAILABLE   AGE
mysql               0/1     1            0           24s
to-do-app-backend   0/2     2            0           7m31s
Step 5. Configure service and deployment for back end
$ kubectl apply -f backend-deployment.yaml
service/to-do-app-backend unchanged
deployment.apps/to-do-app-backend unchanged
$ kubectl get deployments
Step 6. Back-end configuration setup
$ kubectl apply -f backend-configMap.yaml
configmap/backend-conf created
Step 7. Configure service and deployment for frontend
$ kubectl apply -f frontend-deployment.yaml
service/to-do-app-frontend created
deployment.apps/to-do-app-frontend created
$ kubectl get deployments
NAME                 READY   UP-TO-DATE   AVAILABLE   AGE
mysql                1/1     1            1           3m17s
to-do-app-backend    0/2     2            0           10m
to-do-app-frontend   0/2     2            0           25s
Scaling a Kubernetes deployment
$ kubectl scale --replicas=2 deployment/to-do-app-backend to-do-app-backend scaled
$ kubectl scale --replicas=2 deployment/to-do-app-frontend to-do-app-frontend scaled
Deleting Kubernetes resources
Deleting a Pod
kubectl get pods
$ kubectl delete pod to-do-app-backend-69b45499fb-7fh87
pod "to-do-app-backend-69b45499fb-7fh87" deleted
Deleting a Service
$ kubectl get services
$ kubectl delete service to-do-app-backend-service
service "to-do-app-backend-service" deleted
Deleting a Deployment
$ kubectl get deployments
$ kubectl delete deployment to-do-app-backend
deployment.extensions "to-do-app-backend" deleted
Stopping and Deleting the Minikube cluster
Stopping the minikube kubernetes cluster
$ minikube stop
✋  Stopping node "minikube"  ...
🛑  1 nodes stopped.
Deleting the minikube kubernetes cluster
$ minikube delete
Using Helm
Initialization
$ helm init
Update the repositories to their latest versions
$ helm repo update
Deploy
$ helm install your-app
Verify that it’s been set-up
$ helm ls
Monitoring Kubernetes Setup for Prometheus and Grafana
Monitoring Namespace We are going to install the monitoring components into a “monitoring” namespace. While this is not necessary, it does show “best practices” in organizing applications by namespace rather than deploying everything into the default namespace.
First, create the monitoring namespace:
$ kubectl apply -f monitoring-namespace.yaml
namespace/monitoring created
You can now list the namespaces by running:
$ kubectl get namespaces
and you should see something similar to:
NAME                   STATUS   AGE
default                Active   52m
kube-node-lease        Active   52m
kube-public            Active   52m
kube-system            Active   52m
kubernetes-dashboard   Active   39m
monitoring             Active   41s
Prometheus Configuration
Prometheus will get its configuration from a Kubernetes ConfigMap. This allows us to update the configuration separate from the image. Note: there is a large debate about whether this is a “good” approach or not, but for demo purposes this is fine.
Look at prometheus-config.yaml. The
relevant part is in data/prometheus.yml. This is just a Prometheus
configuration
inlined into the Kubernetes manifest. Note that we are using the
in-cluster
Kubernetes service account
to access the Kubernetes API.
To deploy this to the cluster run:
$ kubectl apply -f prometheus-config.yaml.
configmap/prometheus-config created
You can view this by running:
kubectl get configmap --namespace=monitoring prometheus-config -o yaml.
You can also see this in the Kubernetes Dashboard.
Prometheus Pod
We will use a single Prometheus pod for this demo. Take a look at prometheus-deployment.yaml. This is a Kubernetes Deployment that describes the image to use for the pod, resources, etc. Note:
- In the metadata section, we give the pod a label with a key of
nameand a value ofprometheus. This will come in handy later. - In annotations, we set a couple of key/value pairs that will actually allow Prometheus to autodiscover and scrape itself.
- We are using an emptyDir volume for the Prometheus data. This is basically a temporary directory that will get erased on every restart of the container. For a demo this is fine, but we’d do something more persistent for other use cases.
Deploy the deployment by running:
$ kubectl apply -f prometheus-deployment.yaml
You can see this by running:
$ kubectl get deployments --namespace=monitoring
NAME         READY   UP-TO-DATE   AVAILABLE   AGE
prometheus   1/1     1            1           3m20s
Prometheus Service
Now that we have Prometheus deployed, we actually want to get to the UI. To do this, we will expose it using a Kubernetes Service.
In prometheus-service.yaml, there are a few things to note:
- The label selector searches for pods that have been labeled with
name: prometheusas we labeled our pod in the deployment. - We are exposing port 9090 of the running pods.
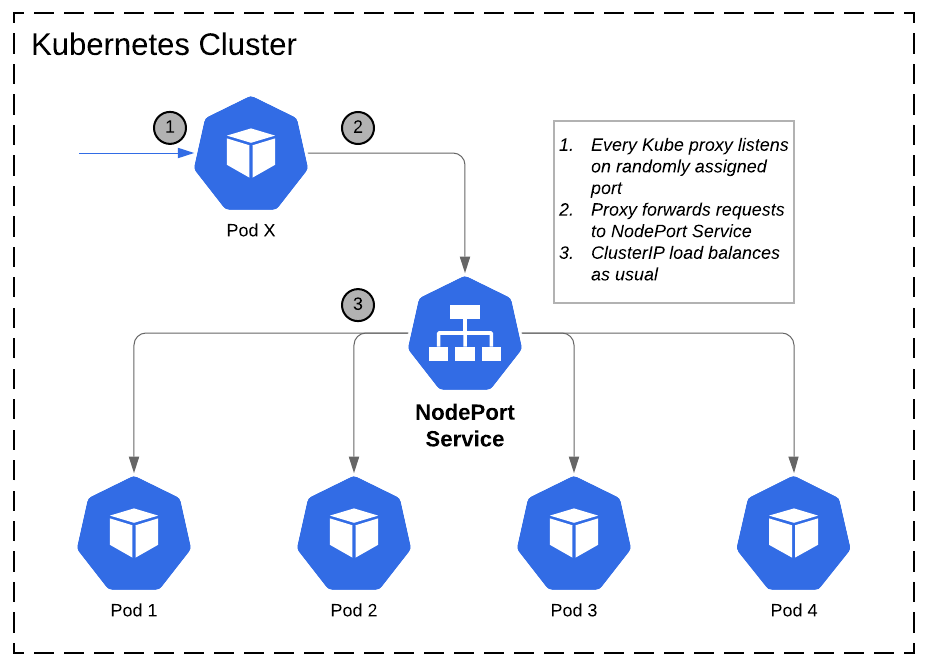
- We are using a “NodePort.” This means that Kubernetes will open a port on each node in our cluster. You can query the API to get this port.
Create the service by running:
$ kubectl apply -f prometheus-service.yaml
You can then view it by running:
$ kubectl get services --namespace=monitoring prometheus -o yaml
One thing to note is that you will see something like nodePort: 30827 in the output. We could access the service on that port on any
node in the cluster.
Minikube comes with a helper to do just that, just run:
$ minikube service --namespace=monitoring prometheus
|------------|------------|-------------|---------------------------|
| NAMESPACE  |    NAME    | TARGET PORT |            URL            |
|------------|------------|-------------|---------------------------|
| monitoring | prometheus |        9090 | http://192.168.64.5:32235 |
|------------|------------|-------------|---------------------------|
🎉  Opening service monitoring/prometheus in default browser...
and it will open a browser window accessing the service.
From the Prometheus console, you can explore the metrics is it
collecting and do some basic graphing. You can also view the
configuration and the targets. Click Status->Targets and you should
see the Kubernetes cluster and nodes. You should also see that
Prometheus discovered itself under kubernetes-pods
Deploying Grafana
You can deploy grafana by creating its deployment and service by
running:
$ kubectl apply -f grafana-deployment.yaml
deployment.apps/grafana created
and
$ kubectl apply -f grafana-service.yaml
service/grafana created
$ kubectl get deployments
Feel free to explore via the kubectl command line and/or the Dashboard.
Minikube comes with a helper to do just that, just run:
$ minikube service --namespace=monitoring prometheus
Go to grafana by running:
$ minikube service --namespace=monitoring grafana
|------------|---------|-------------|---------------------------|
| NAMESPACE  |  NAME   | TARGET PORT |            URL            |
|------------|---------|-------------|---------------------------|
| monitoring | grafana |        3000 | http://192.168.64.5:30595 |
|------------|---------|-------------|---------------------------|
🎉  Opening service monitoring/grafana in default browser...
Username is admin and password is also admin.
Let’s add Prometheus as a datasource.
- Click on the icon in the upper left of grafana and go to “Data Sources”.
- Click “Add data source”.
- For name, just use “prometheus”
- Select “Prometheus” as the type
- For the URL, we will actual use Kubernetes DNS service
discovery. So,
just enter
http://prometheus:9090. This means that grafana will lookup theprometheusservice running in the same namespace as it on port 9090.
Create a New dashboard by clicking on the upper-left icon and
selecting Dashboard->New. Click the green control and add a graph
panel. Under metrics, select “prometheus” as the datasource. For the
query, use sum(container_memory_usage_bytes) by (pod_name). Click
save. This graphs the memory used per pod.
Import useful Grafana Dashboards
- Prometheus 2.0 - https://grafana.com/grafana/dashboards/3662
- Node Exporter - https://grafana.com/grafana/dashboards/1860
- Kubernetes Cluster - https://grafana.com/grafana/dashboards/315
- Kubernetes Deployment metrics - https://grafana.com/grafana/dashboards/741
- Kubernetes nginx ingress stats - https://grafana.com/grafana/dashboards/3050
Check Grafana e Prometheus is running
$ kubectl get pods -n monitoring
NAME                         READY   STATUS    RESTARTS   AGE
grafana-768c445f79-xzb85     1/1     Running   0          29m
node-exporter-4j9xb          1/1     Running   0          10m
prometheus-cdb97c4d4-69l5k   1/1     Running   0          33m
Port Forward the Grafana dashboard to see whats happening:
$ export POD_NAME=$(kubectl get pods --namespace monitoring -l "app=grafana,release=grafana" -o jsonpath="{.items[0].metadata.name}")
$ kubectl --namespace monitoring port-forward $POD_NAME 3000
Prometheus Node Explorer
We can also use Prometheus to collect metrics of the nodes themselves. We use the node exporter for this. We can also use Kubernetes to deploy this to every node. We will use a Kubernetes DaemonSet to do this.
In node-exporter-daemonset.yml you
will see that it looks similar to the deployment we did earlier.
Notice that we run this in privileged mode (privileged: true) as it
needs access to various information about the node to perform
monitoring. Also notice that we are mounting in a few node directories
to monitor various things.
Run $ kubectl apply -f node-exporter-daemonset.yml
daemonset.apps/node-exporter created
to create the daemon set. This will run an instance of this on every node. In minikube, there is only one node, but this concept scales to thousands of nodes.
You can verify that it is running by using the command line or the dash board.
After a minute or so, Prometheus will discover the node itself and
begin collecting metrics from it. To create a dashboard in grafana
using node metrics, follow the same procedure as before but use
node_load1 as the metric query. This will be the one minute load
average of the nodes.
Note: in a “real” implementation, we would label the pods in an easily queryable pattern.
To cleanup, you can delete the entire monitoring namespace:
$ kubectl delete namespace monitoring
Alternatively
Quick start
To quickly start all the things just do this:
$ kubectl apply \ --filename https://raw.githubusercontent.com/giantswarm/prometheus/master/manifests-all.yaml
This will create the namespace monitoring and bring up all components in there.
To shut down all components again you can just delete that namespace:
$ kubectl delete namespace monitoring
Default Dashboards
If you want to re-import the default dashboards from this setup run this job:
$ kubectl apply --filename ./manifests/grafana/import-dashboards/job.yaml
In case the job already exists from an earlier run, delete it before:
$ kubectl --namespace monitoring delete job grafana-import-dashboards
To access grafana you can use port forward functionality:
$ kubectl port-forward --namespace monitoring service/grafana 3000:3000
And you should be able to access grafana on http://localhost:3000/login
Useful commands
$ kubectl version --short=true$ minikube version$ kubectl cluster-info$ kubectl get pods --all-namespaces$ kubectl get nodes$ minikube dashboard$ minikube addons list$ kubectl config current-context minikube
References
- https://kubernetes.io/docs/reference/kubectl/cheatsheet/
- https://aws.amazon.com/ecr/
- https://cloud.google.com/container-registry/
- https://azure.microsoft.com/en-us/services/container-registry/#features
- https://github.com/giantswarm/prometheus
- https://dev.to/molamk-running-a-node-js-app-with-docker-kubernetes-and-minikube-10d4
- https://www.callicoder.com/deploy-containerized-go-app-kubernetes/
- https://github.com/prometheus-operator/kube-prometheus
- https://github.com/camilb/prometheus-kubernetes
- https://github.com/bakins/minikube-prometheus-demo
- https://grafana.com/grafana/dashboards/315
- https://github.com/ibuchh/prometheus-grafana-kubernetes
- https://github.com/Angular2Guy/AngularPwaMessenger
- https://dzone.com/articles/an-angular-pwa-from-front-end-to-backend-kubernetes
- https://chris-vermeulen.com/how-to-monitor-your-kubernetes-cluster-with-prometheus-and-grafana/
- https://laptrinhx.com/getting-started-with-kontena-lens-on-minikube-3318954583/
Please, follow our social networks:
Thank You and until the next one! 😉👍
Published on Dec 17, 2020 by Vinicius Moll