
Here follows some sample SRE dashboards in Grafana.
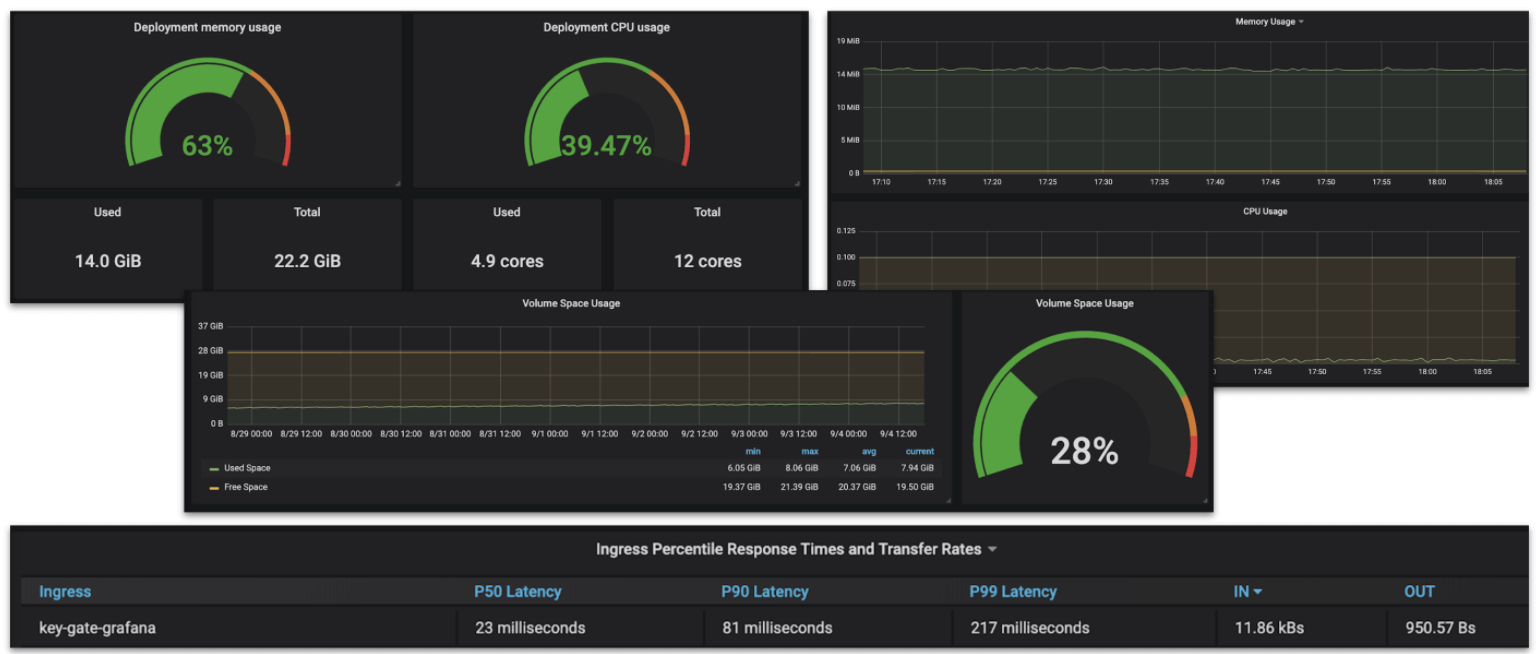
SRE Grafana Dashboard - 1
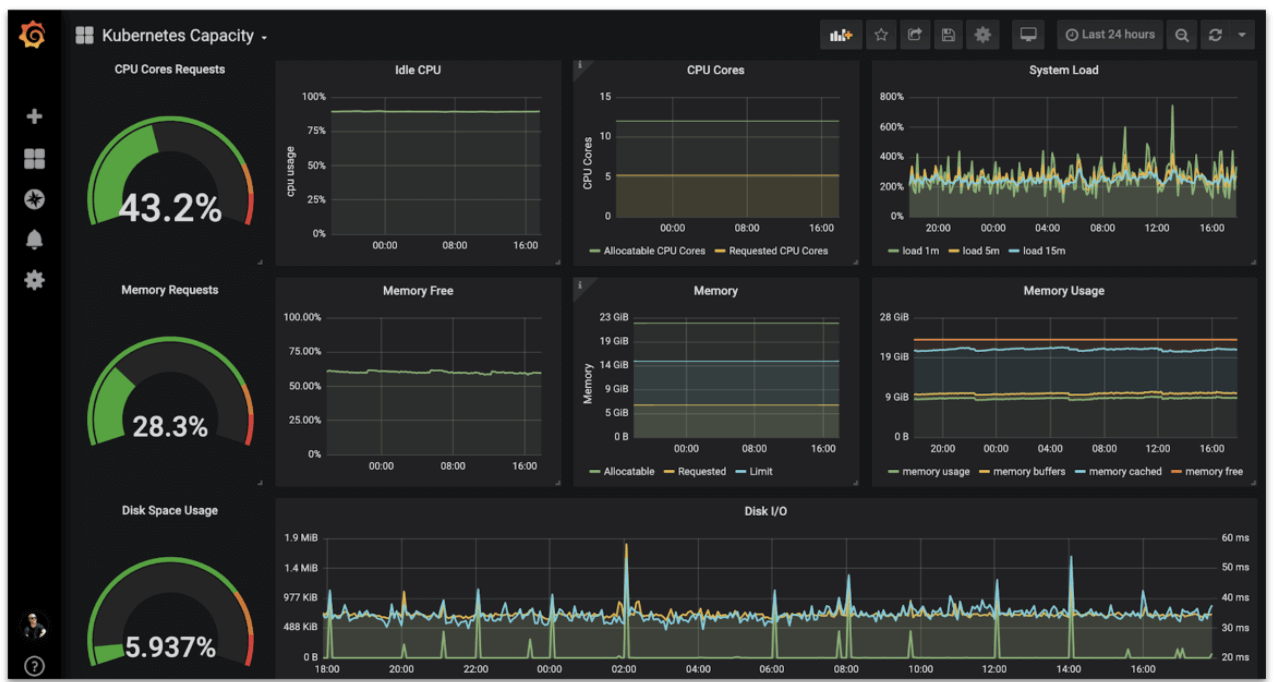
SRE Grafana Dashboard - 2
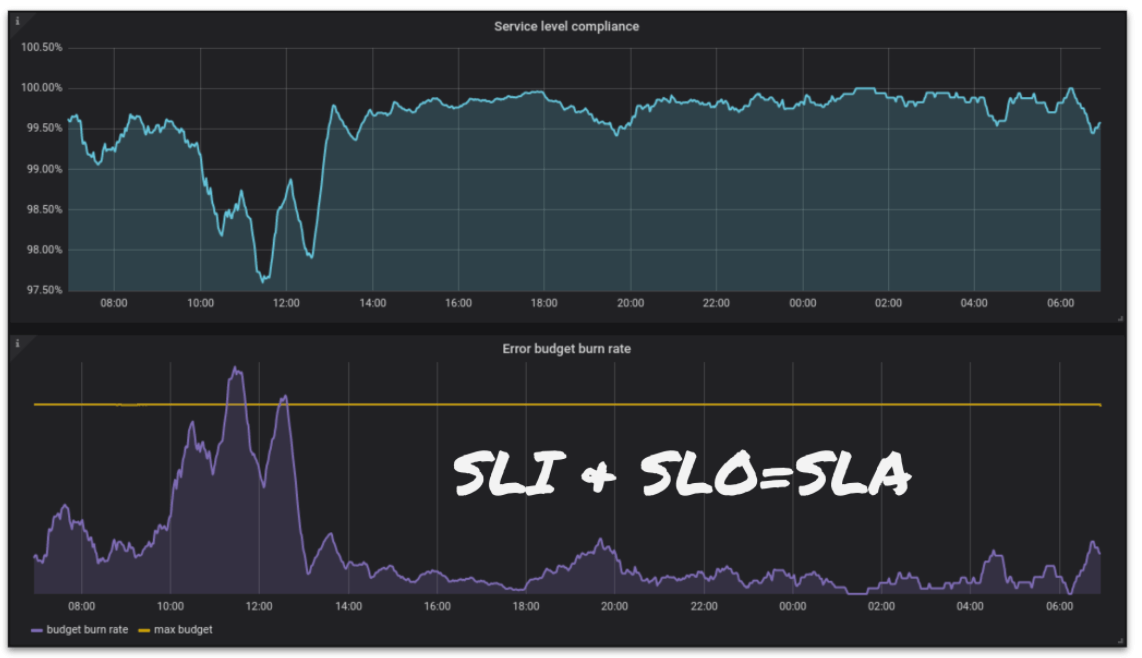
SRE Grafana Dashboard - 3
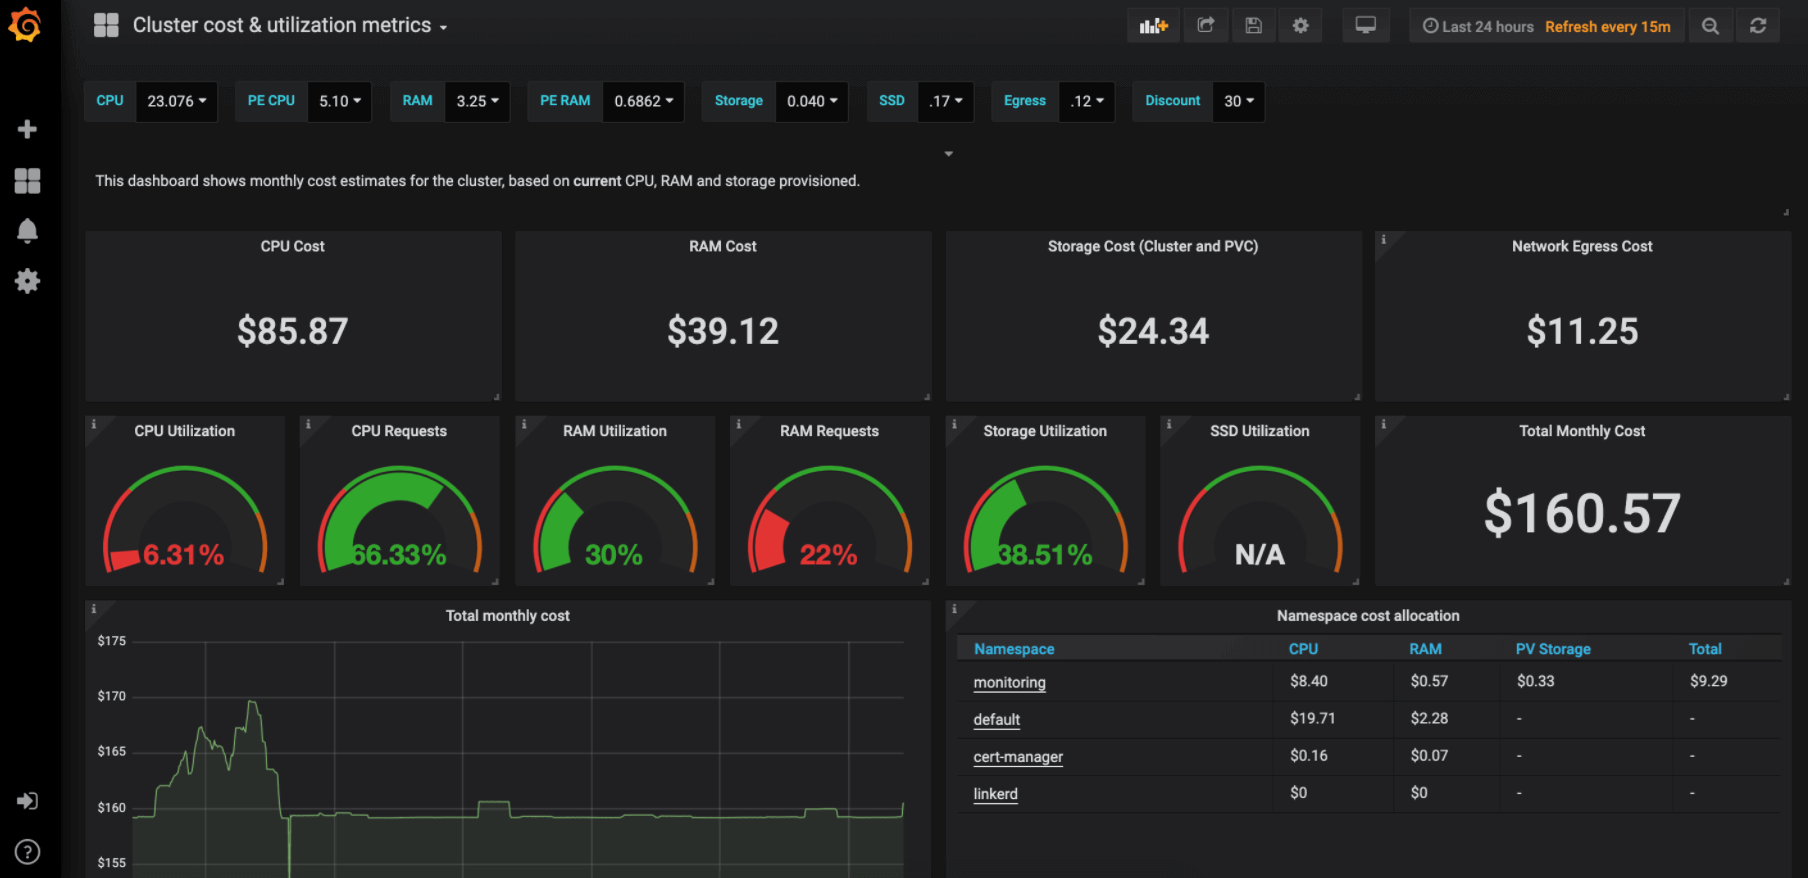
SRE Grafana Dashboard - 4
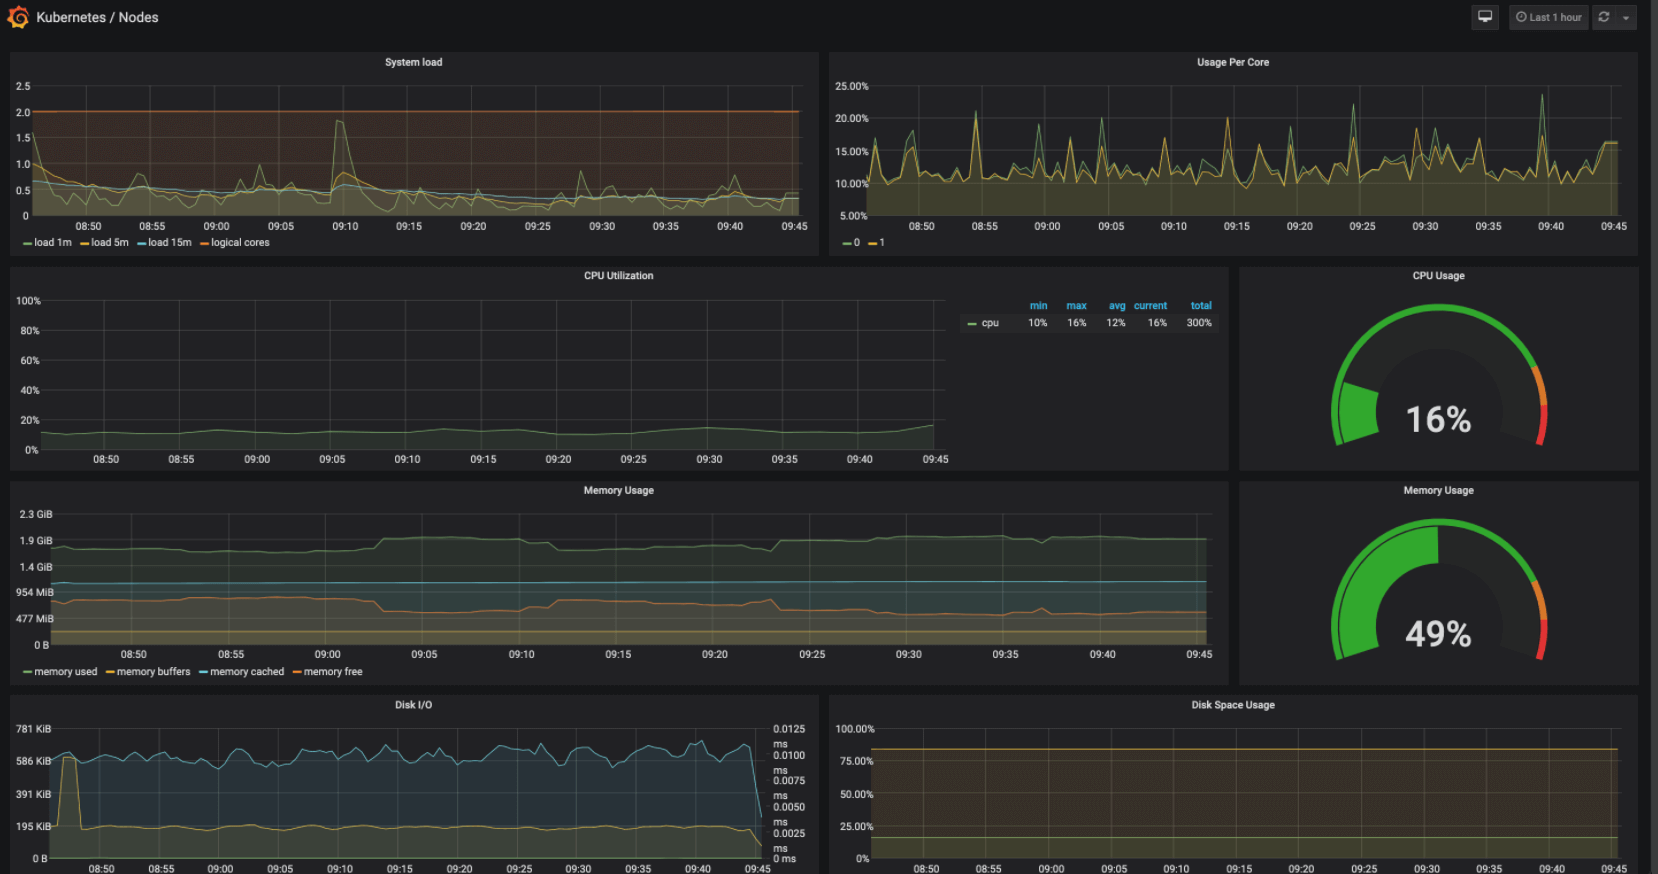
SRE Grafana Dashboard - 5
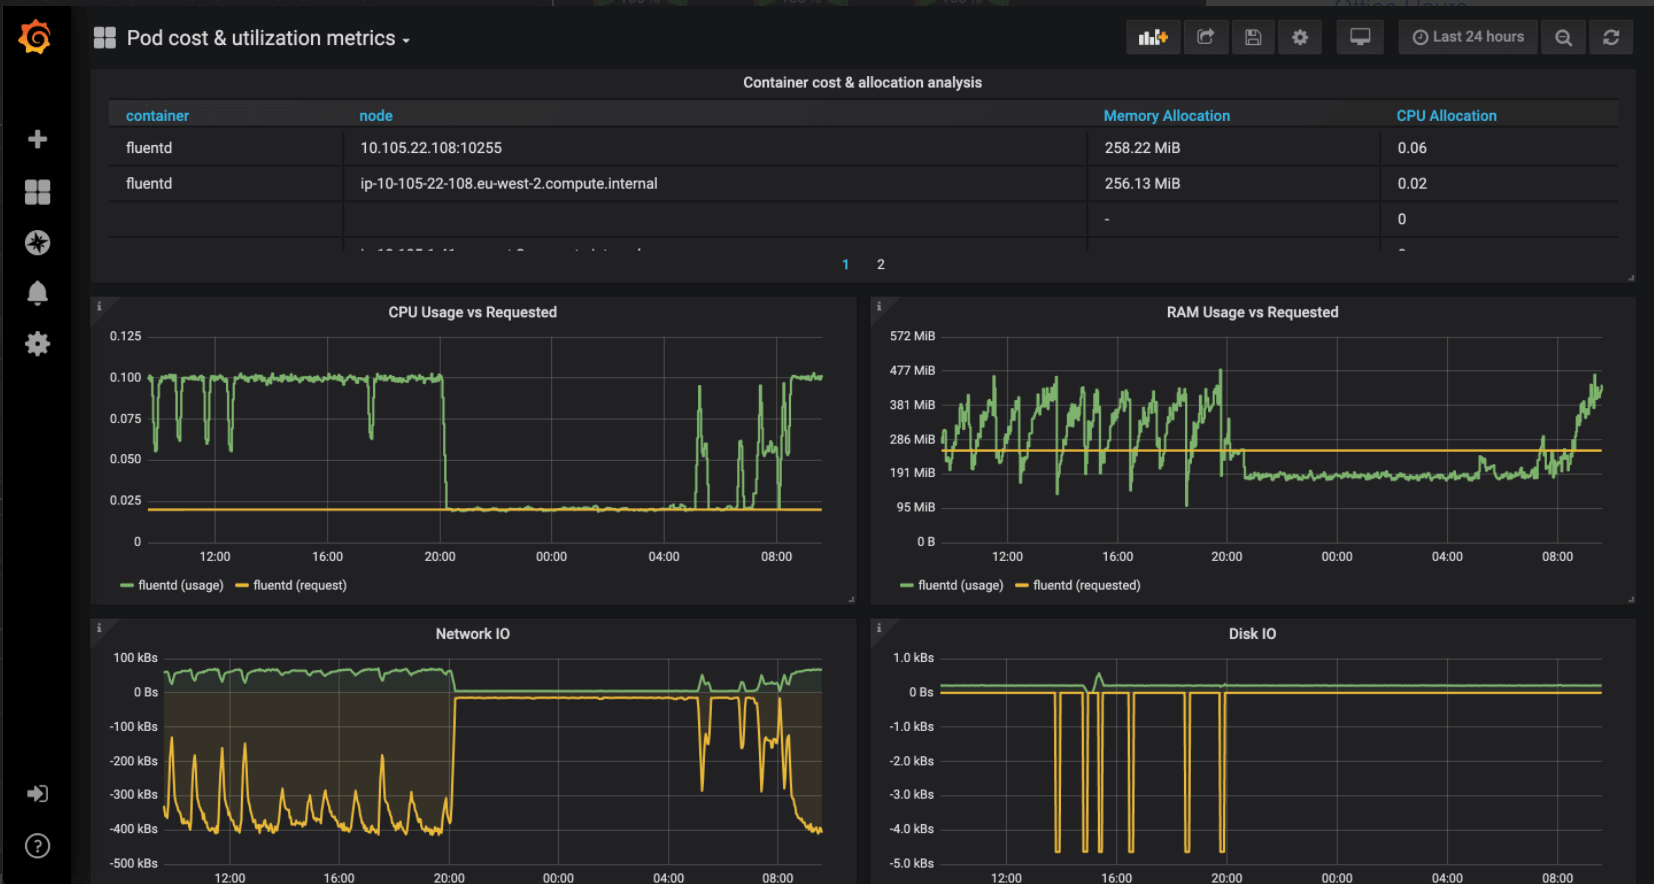
SRE Grafana Dashboard - 6
http://demo.robustperception.io:9090/consoles/index.html
https://www.atlassian.com/br/incident-management/devops/sre
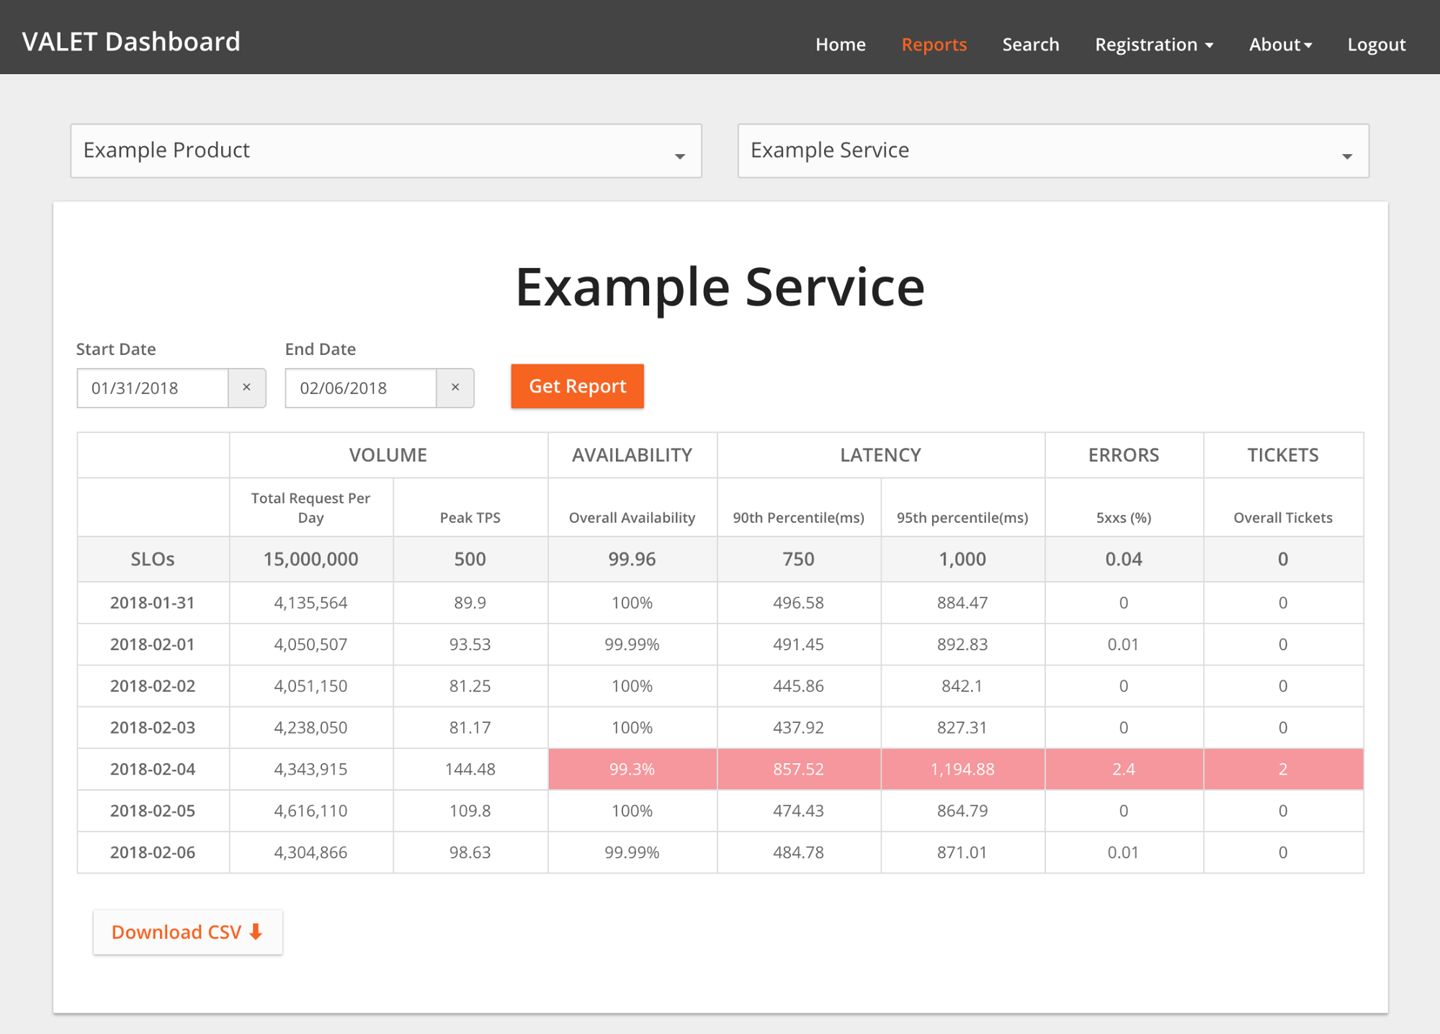
SRE Google VALET Dashboard
https://landing.google.com/sre/workbook/chapters/slo-engineering-case-studies/#the-valet-dashboard
What does the ideal SRE dashboard look like? Make sure it has these KPIs:
SLO violation duration graph, response time (99th percentile) and load for your critical API calls
-
Error rate
-
Database response time
-
End-user response time (99th percentile)
-
Requests per minute
-
Availability
-
Session duration
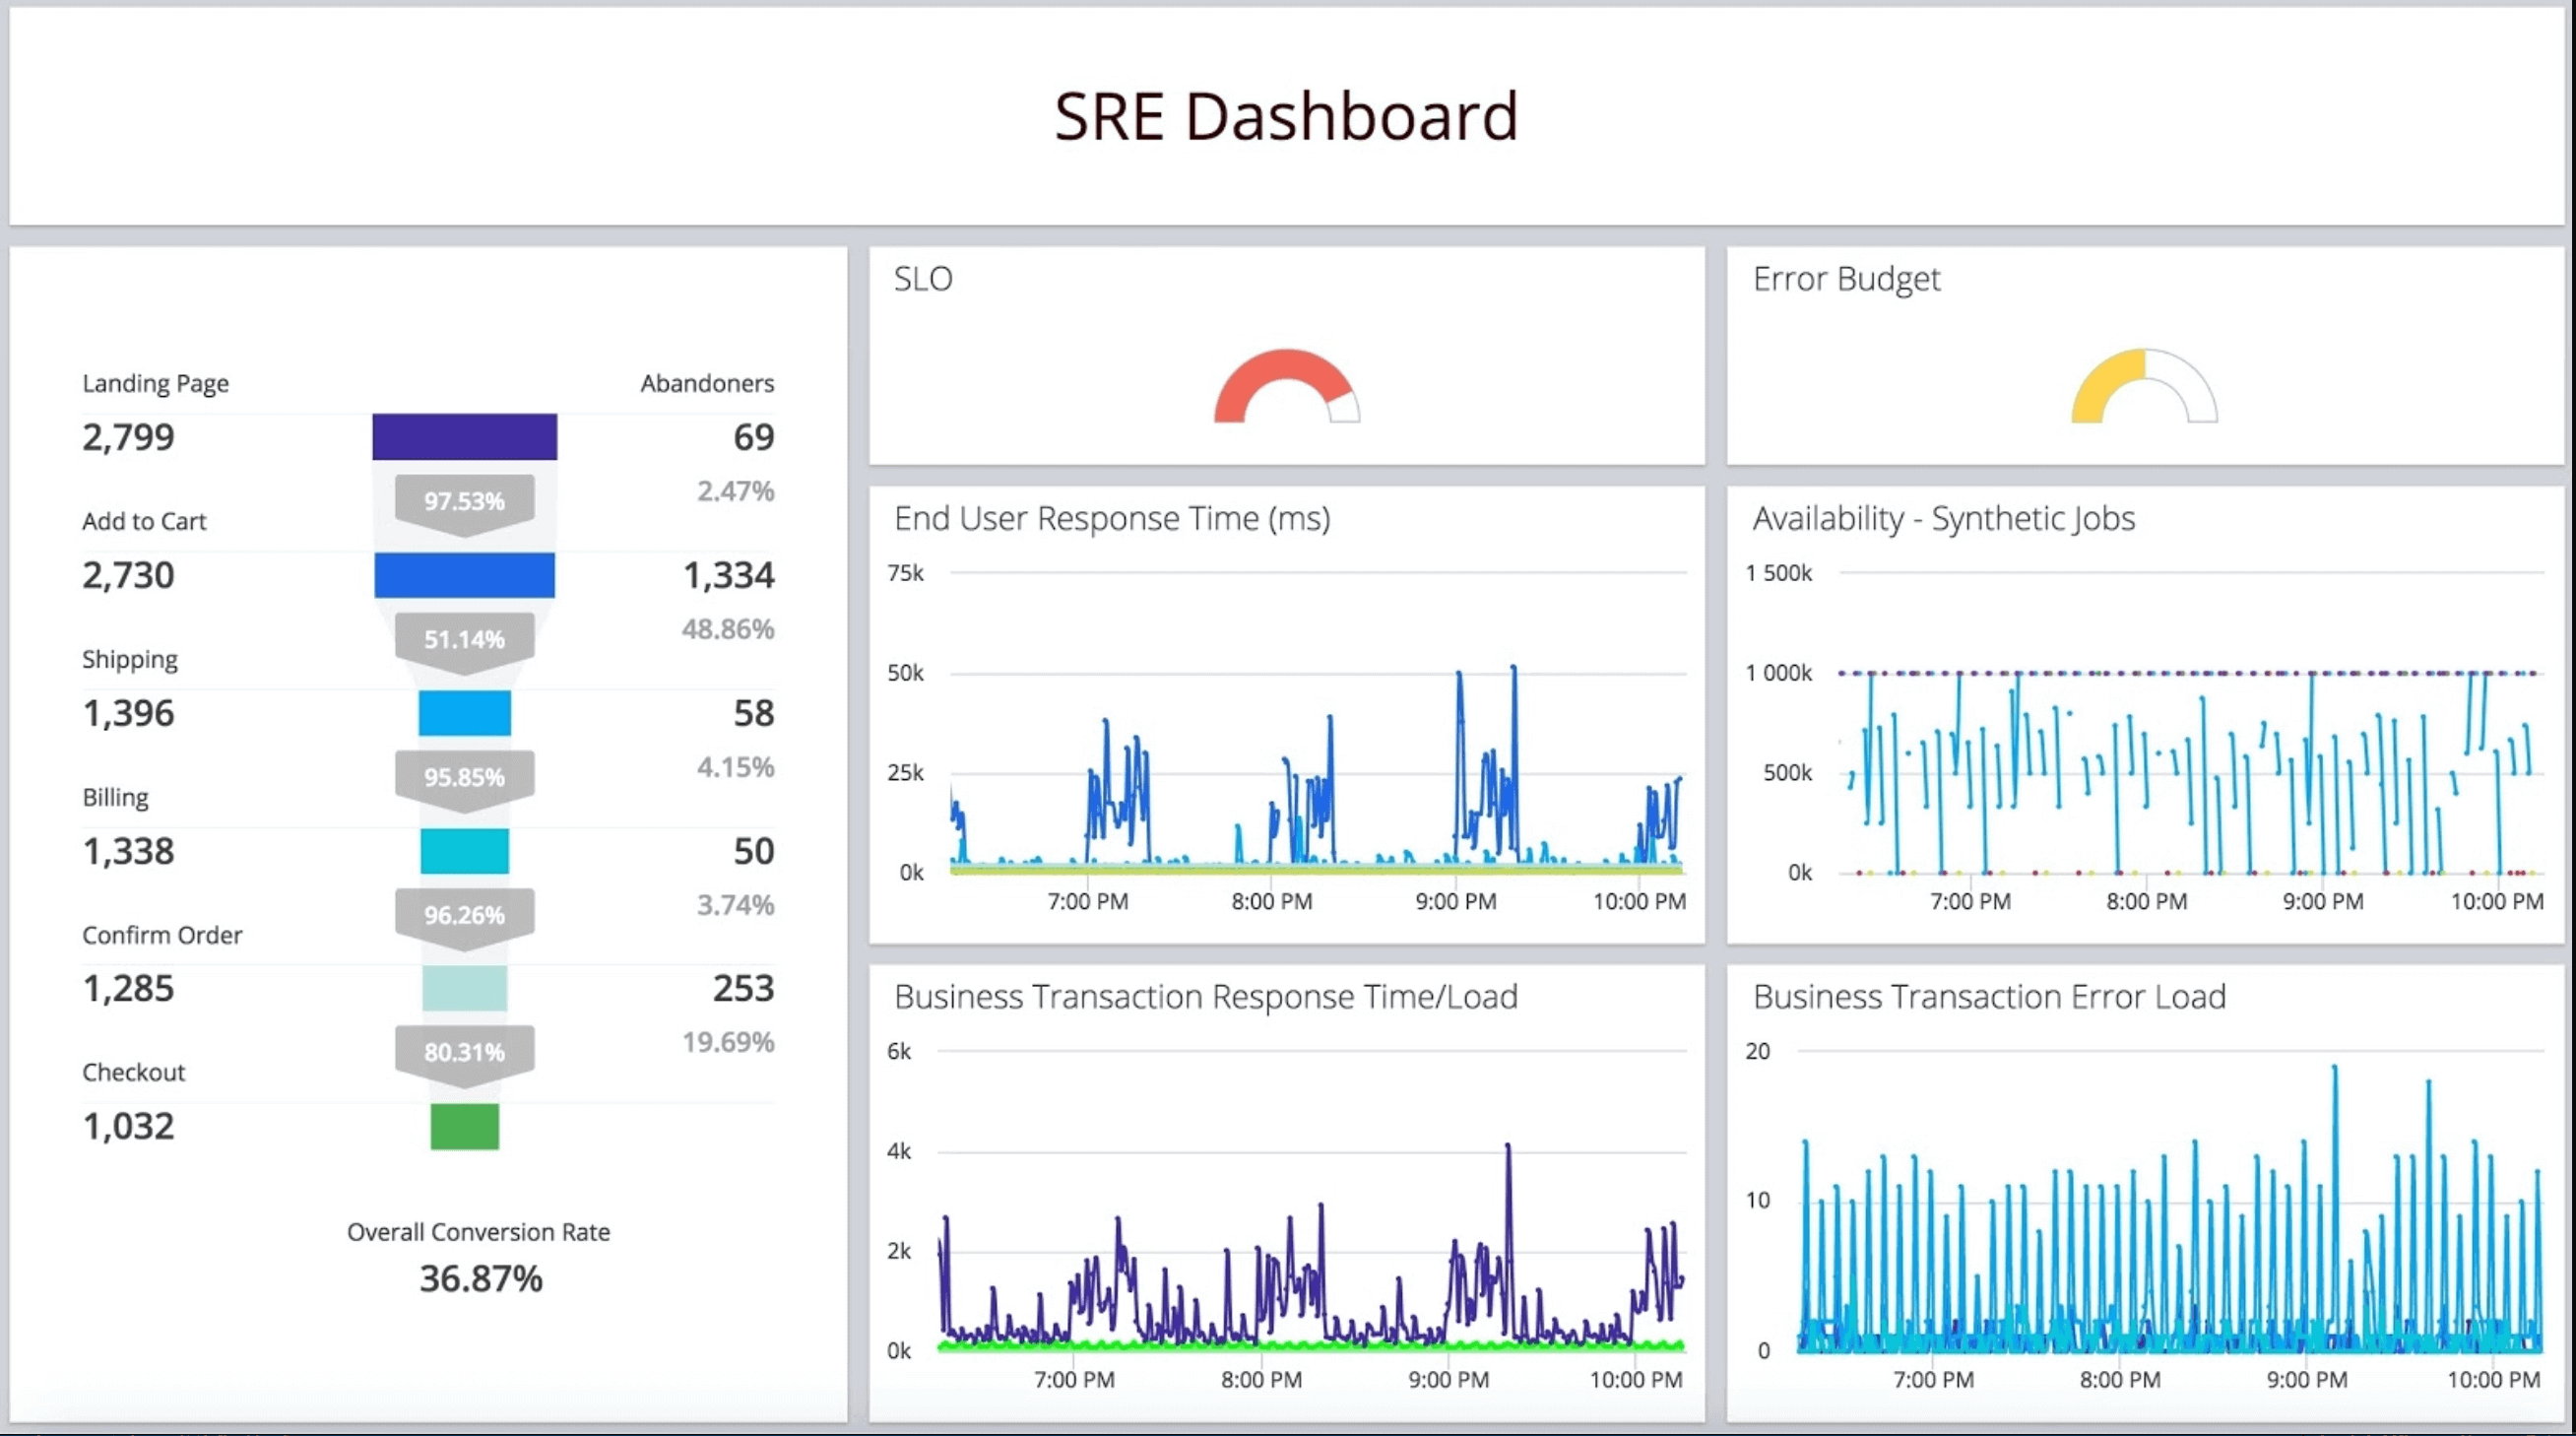
SRE VALET sample Dashboard Web application
https://www.appdynamics.com/blog/product/software-reliability-metrics/
